Ellis Günther · 6 September 2026
Revolutionizing Soil Data Visualization for Environmental Consultants
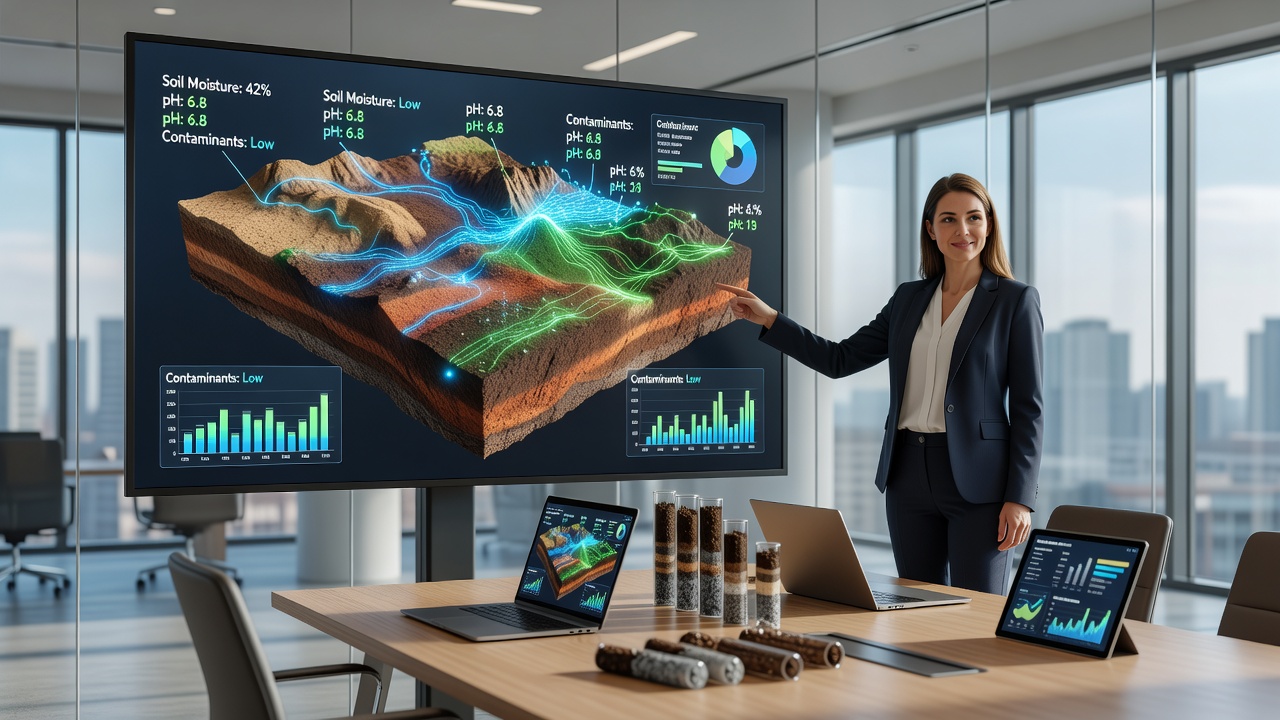
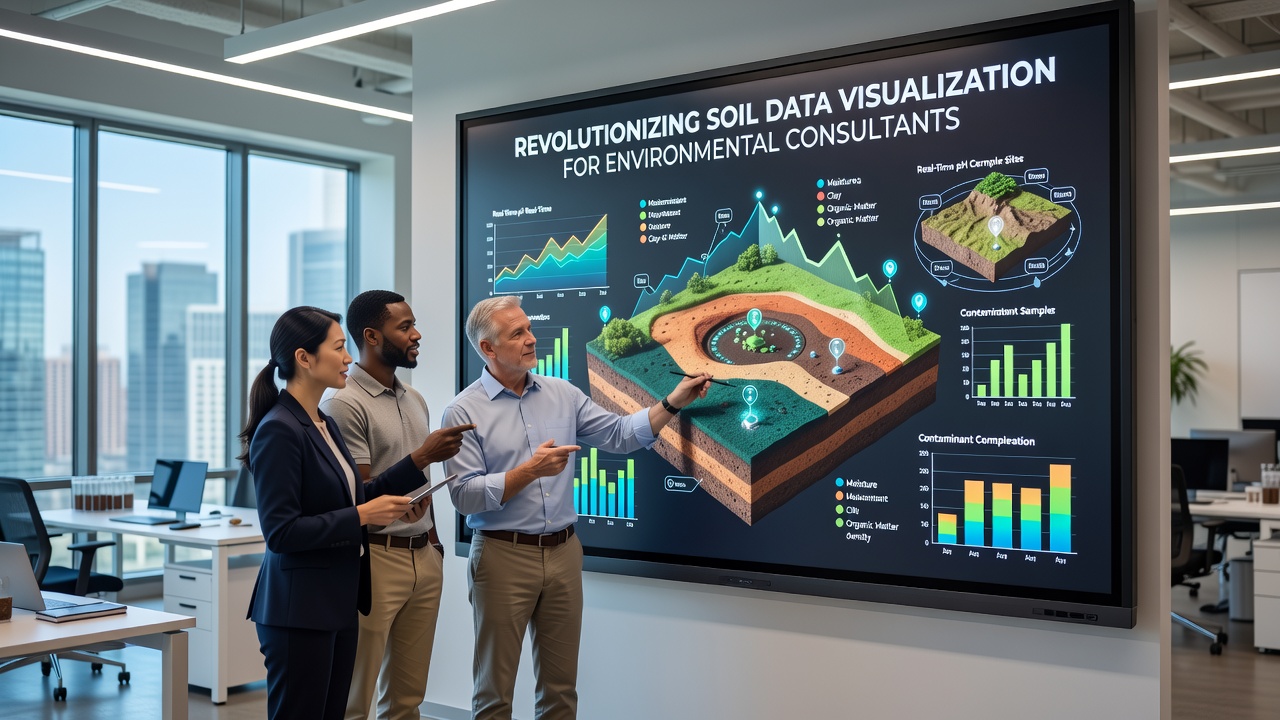
Environmental consultants handle complex soil datasets that range from contaminant concentrations to nutrient profiles and structural properties. Traditional spreadsheets and static maps often fall short when teams need to interpret layered information across large sites. New visualization platforms now combine geographic information systems with real-time rendering engines, allowing consultants to explore three-dimensional models that update as fresh samples arrive. Researchers at multiple institutions note that these tools integrate satellite imagery, drone surveys, and laboratory results into unified interfaces. Data streams flow directly from field sensors into cloud-based dashboards where users adjust variables like depth, pH levels, or heavy-metal thresholds on the fly. The shift reduces the time required to produce client-ready reports while maintaining traceability for regulatory submissions.Core Technologies Driving Change
Geographic information systems remain the foundation, yet modern implementations add machine-learning layers that predict soil behavior between sampling points. Consultants load borehole logs into algorithms that generate continuous surfaces rather than isolated data points. This approach highlights potential contamination plumes before they appear in conventional two-dimensional plans.
Three-dimensional modeling software accepts multiple coordinate systems and projects them onto shared canvases. Teams working across state or national boundaries can therefore align datasets collected under different standards without manual conversion. Visualization engines also support temporal sliders, so users scroll through historical records to observe seasonal shifts in moisture or salinity.
Practical Applications in Consulting Workflows
Site assessments for redevelopment projects illustrate the practical impact. A consultant reviewing an industrial brownfield can overlay soil chemistry results on proposed building footprints within minutes. Color-coded risk zones update automatically when new laboratory certificates upload, giving stakeholders immediate visibility into areas requiring remediation.
Compliance reporting benefits equally. Agencies in several regions now accept interactive deliverables instead of printed appendices. The US Environmental Protection Agency maintains portals where consultants submit visualized datasets that regulators can query directly. Similar systems operated by the European Environment Agency allow cross-border projects to maintain consistent formatting while satisfying local requirements.
Integration with Field Operations
Handheld devices and vehicle-mounted sensors transmit readings to central servers during active surveys. Visualization software then flags anomalies in real time, prompting crews to collect additional samples before leaving the site. This closed loop cuts repeat visits and improves data density in critical zones.
Training programs at universities and professional associations now include modules on these platforms. Students learn to construct queries that isolate specific contaminant pathways while preserving the broader geological context. Graduates entering the workforce therefore arrive already familiar with the interfaces their future employers rely upon.
Developments Expected by September 2026
Industry observers anticipate standardized application programming interfaces that connect visualization tools directly to national soil databases. Pilot programs scheduled for late 2025 will test automated compliance checks against these feeds. If successful, consultants could generate regulatory summaries without exporting data to separate formats.
Augmented-reality overlays represent another active area. Field teams wearing lightweight headsets will view subsurface models aligned with physical landmarks. Early tests conducted by research groups in Australia and Canada show reduced errors when crews mark excavation boundaries using these visual references instead of paper plans.
Conclusion
Soil data visualization continues to evolve through tighter integration of sensors, algorithms, and regulatory platforms. Environmental consultants gain clearer pictures of subsurface conditions while meeting documentation standards that grow more data-intensive each year. The combination of established geographic tools with emerging real-time and predictive capabilities supports faster, more defensible decisions across the sector.